Chainlink trades near $9.99 after clearing its $9.93 range high, with $11.97 and $12.87 as key upside levels.
Chainlink is testing a key breakout after months of sideways trading between $8.24 and $9.93.
LINK recently traded near $9.99 on the daily chart, placing price just above the upper range.
Traders are now watching whether the move can extend toward $11.97 and then $12.87.
Chainlink Moves Past Months-Long Range
Chainlink had been trading inside a narrow range for several months. The lower boundary was near $8.24, while the upper boundary stood near $9.93.
This price action showed a long period of market compression. Now, LINK is trading near $9.99, slightly above the range high.
That move has placed the breakout area back in focus. However, traders are watching for a daily close to confirm strength.
LINK breaking out of range right now.
$LINK has been coiling between $8.24 and $9.93 for months.
It’s breaking out as we speak.
Range target sitting at $11.97. Next major level above that: $12.87.
The ones who spotted this early?
TBN members.
Not a signal. Not financial… pic.twitter.com/DIDx9unZbr
— THE ₿IRB NEST (@TheBirbNest) May 6, 2026
A market update shared online said, “LINK has been coiling between $8.24 and $9.93 for months.” The same post said the token was breaking out of that range. It also placed the range target at $11.97.
The next level above that target is near $12.87. This level may become important if buyers keep control. For now, the breakout remains early and still needs follow-through.
LINK Price Faces Resistance Near 11 Dollars
Chainlink still faces resistance above its current price. The first key area sits between $10.50 and $11.00. A daily close above this zone could support a stronger move.
If LINK clears that area, the $11.97 target may come into focus. This target comes from the recent range structure. It also matches the current short-term breakout view.
After that, traders may watch $12.50 and $12.87. These levels sit near earlier supply zones on the chart. Sellers may become active there if the price moves higher.
The wider resistance zone remains between $12.50 and $15.00. LINK traded below this area after a larger decline in early 2026.
Therefore, a move above that range would be needed for broader strength.
Read Also:
Chainlink Whale Pulls $1.49M LINK From Binance as Price Still Falls
Support And Indicators Guide Near-Term Setup
On the downside, Chainlink has support near $8.00 to $8.50. This area held during the recent pullback. It also helped price recover toward the current breakout zone.
If LINK falls back below $9.93, traders may watch this support again. A move below $8.00 would weaken the short-term setup. The next major level would then sit near $7.50.
The MACD shows early positive momentum on the daily chart. The MACD line is slightly above the signal line. Also, the histogram has turned green, showing better short-term buying strength.
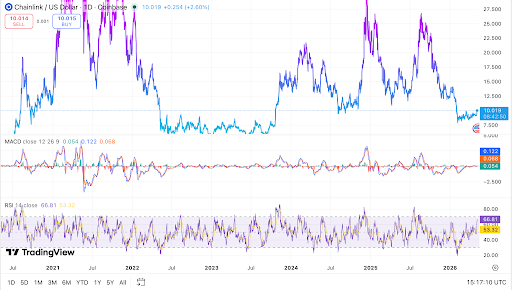
The RSI is near 66, which shows stronger demand. It remains below the overbought zone near 70.
As a result, LINK still has room to rise, but resistance remains close. For now, Chainlink’s breakout depends on price holding above the range high.
A sustained move above $10.50 could bring $11.97 into view. If buyers fail to hold the breakout, LINK may return to its earlier trading range.
The post Chainlink Breakout From Months-Long Range Puts 11.97 Target In Focus appeared first on Live Bitcoin News.