HYPE nears $66 resistance as a bearish head and shoulders pattern forms, with $54 support remaining the key level.
Hyperliquid’s HYPE token is trading near $65.92 after gaining about 9.5% over the past 24 hours.
The move has placed the token near a key resistance area, where buyers now face an important test.
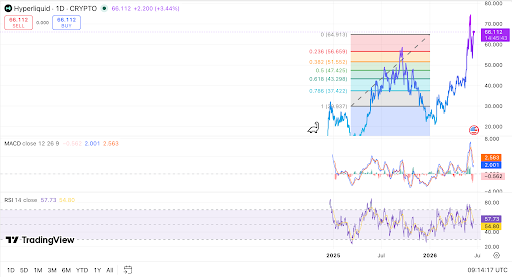
The daily chart shows HYPE trading close to the $65 region, which has become a major level for short-term direction.
Analysts are watching this area because the token may be forming the right shoulder of a head and shoulders pattern.
This setup remains unconfirmed because HYPE has not yet lost its main support near $54.
A clear break below that level would confirm the bearish structure and may shift market attention toward lower support areas.
However, the wider trend still shows strength while price holds above nearby support levels.
The market is now focused on whether HYPE can break resistance or move back toward the neckline.
HYPE Tests Resistance Near $65
Hyperliquid is currently trading near the upper end of its recent 24-hour range, which runs from $59.74 to $65.90.
This shows that buyers remained active during the latest session, although price is now facing resistance.
The $65 zone has become important because it may shape the right shoulder of the pattern.
A head and shoulders pattern often forms after a strong rally and signals possible trend weakness.
In HYPE’s case, the market has already reached the $70 to $75 area before pulling back. That earlier rejection has made the current move toward $65 an important test.
If HYPE fails to hold above this zone, sellers may gain more control in the near term.
However, a clean daily close above $65 could delay the bearish setup and support another retest higher. Traders are also watching whether volume rises during any breakout attempt.
CoinGecko data shows HYPE trading near $65.92, up 9.5% in 24 hours. It also gained 7.4% against Bitcoin to 0.001004 BTC.
The token traded between $59.74 and $65.90, placing it near short-term resistance at $66.
A break above $66 could open the way toward $68 and $70. Support sits near $63.50 to $64.00, then $59.74. A drop below $59.74 would weaken the current bullish setup.
Why the $54 Level Matters
The $54 level is viewed as the key support area within the current chart structure. A move below this level would confirm the bearish head and shoulders pattern for many traders.
Such a breakdown would suggest that demand has weakened below the neckline area. Before the price reaches $54, HYPE may still react around nearby support levels.
The first area to watch is around $64.91, which was a prior Fibonacci swing high. If that level fails, the next support zones sit near $56.66 and $51.55.
Hyperliquid $HYPE is shaping what looks like the right shoulder of a head and shoulders pattern.
For now, $65 is the key resistance level.
Lose $54, and the bearish pattern would be confirmed. pic.twitter.com/IntXRZyW9S
— Ali Charts (@alicharts) June 15, 2026
The wider chart still shows a strong advance from earlier lows, so the pattern remains unconfirmed for now.
Because of that, traders are treating $54 as the key invalidation point for the bullish structure. Until that level breaks, the market remains in a mixed technical position.
Read Also:
Hyperliquid Drives Net Deflation As Daily Buybacks Outpace Rewards Flow
MACD and RSI Show Cooling Momentum
Momentum readings show that buying pressure has eased after HYPE’s sharp move higher.
The MACD remains positive, but the MACD line has moved below the signal line. This setup shows that upside momentum has slowed, even as the broader trend remains elevated.
The RSI is near 57.6, placing it in neutral-to-bullish territory on the daily chart. It has cooled from the overbought area, which shows that the latest rally has lost some strength.
Even so, the RSI remains above the midline, meaning sellers have not fully taken control.
For now, HYPE’s direction depends on whether price can reclaim strength above $65 or break below $54.
A move above $70 to $75 would weaken the bearish pattern and reopen the upside range.
A drop under $54 would confirm the bearish structure and shift attention to lower support levels.
The post Hyperliquid (HYPE) Forms Bearish Pattern: Why $54 Is Critical appeared first on Live Bitcoin News.